How to Automate Inventory Forecasting with AI: Complete Setup Guide
Inventory management remains one of the most critical yet challenging aspects of running a data-driven business. With global supply chain disruptions causing an average of 23% increase in stockout costs and 15% rise in carrying costs over the past two years, companies are turning to AI-powered forecasting to maintain optimal inventory levels. This comprehensive guide will walk you through building an automated inventory forecasting system that predicts demand patterns and triggers reorder alerts before stockouts occur.
The Problem: Manual Inventory Management is Costing You Money
Traditional inventory management relies on historical averages, gut feelings, and reactive ordering. This approach leads to several costly problems:
- Stockouts: Lost sales averaging $1.1 trillion annually across retail industries
- Overstock: Carrying costs consuming 20-30% of inventory value yearly
- Manual errors: Human forecasting accuracy typically ranges between 40-60%
- Time waste: Inventory managers spend 40+ hours weekly on manual calculations
- Seasonal blindness: Missing demand patterns that occur across multiple time horizons
AI-powered forecasting addresses these issues by analyzing multiple data streams simultaneously, identifying complex patterns human analysts miss, and automatically adjusting predictions based on real-time market conditions. Companies implementing automated forecasting report 15-25% reduction in inventory costs and 90%+ forecast accuracy.
Essential Tools for AI Inventory Forecasting
Building an effective automated inventory forecasting system requires the right combination of data management, AI processing, and workflow automation tools. Here’s what you’ll need:
Core Infrastructure
| Tool Category | Recommended Solution | Monthly Cost | Key Features |
|---|---|---|---|
| Data Management | Airtable Pro | $20/user | API integrations, formula fields, automation triggers |
| AI/ML Platform | Google Cloud AI Platform | $50-200/month | AutoML, custom models, real-time predictions |
| Workflow Automation | Zapier Professional | $49/month | Multi-step workflows, webhook triggers, 1000+ integrations |
| Business Intelligence | Tableau Online | $70/user | Real-time dashboards, predictive analytics, mobile access |
| Communication | Slack + Email | $7.25/user | Instant alerts, threaded discussions, file sharing |
Optional Integrations
Depending on your existing tech stack, you may want to integrate with:
- CRM Systems: Salesforce or Pipedrive for sales data correlation
- ERP Platforms: NetSuite, SAP, or QuickBooks for financial data
- E-commerce: Shopify, WooCommerce, or Magento for online sales data
- Supply Chain: TradeGecko, inFlow, or Cin7 for supplier information
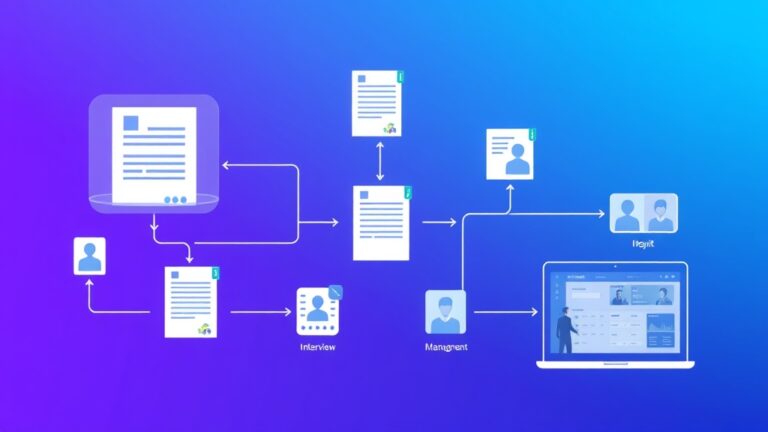
Step-by-Step Implementation Workflow
Phase 1: Data Collection and Preparation (Week 1-2)
Step 1: Set up your data hub in Airtable
Create a comprehensive inventory database structure:
Base: "Inventory Forecasting Hub"

Table 1: "Products"
- Product ID (Primary Key)
- SKU
- Product Name
- Category
- Unit Cost
- Supplier ID
- Lead Time (Days)
- Reorder Point
- Safety Stock Level

Table 2: "Sales History"
- Date
- Product ID (Linked to Products)
- Quantity Sold
- Revenue
- Channel (Online/Retail/B2B)
- Geographic Region

Table 3: "Inventory Levels"
- Date
- Product ID (Linked to Products)
- Stock Level
- Warehouse Location
- Last Updated

Table 4: "External Factors"
- Date
- Weather Data
- Promotional Events
- Competitor Pricing
- Economic Indicators
Step 2: Configure data ingestion
Set up automated data imports using Airtable’s API or Zapier connections:
- Connect your POS system to automatically update sales data hourly
- Link inventory management system for real-time stock levels
- Integrate external data sources (weather APIs, economic indicators)
- Set up data validation rules to catch anomalies early
Pro Tip: Clean historical data is crucial for AI accuracy. Spend extra time ensuring your past 2-3 years of sales data is complete and standardized before proceeding to model training.
Phase 2: AI Model Development (Week 3-4)
Step 3: Choose your forecasting approach
For most businesses, a hybrid approach works best:
- Time Series Analysis: ARIMA or Prophet for trend identification
- Machine Learning: Random Forest or XGBoost for complex pattern recognition
- Deep Learning: LSTM neural networks for seasonal products
Step 4: Set up Google Cloud AI Platform
- Create a new Google Cloud project
- Enable AI Platform API and AutoML Tables
- Upload your prepared dataset from Airtable
- Configure target variable (future demand) and feature columns
- Train initial models with 80/20 train/test split
Step 5: Model training configuration
Training Parameters:
- Prediction horizon: 30, 60, 90 days
- Update frequency: Weekly
- Confidence intervals: 80%, 95%
- Seasonality detection: Auto
- External regressor inclusion: Weather, promotions, holidays
Phase 3: Automation Setup (Week 5-6)
Step 6: Create reorder alert triggers
Build multi-condition logic in Zapier:
- Trigger: Daily inventory level check (via Airtable webhook)
- Condition 1: Current stock ≤ Predicted demand + Safety stock
- Condition 2: Lead time + Processing time ≤ Days until stockout
- Action: Generate reorder recommendation with quantities
Step 7: Configure alert workflows
| Alert Type | Trigger Condition | Recipients | Action Required |
|---|---|---|---|
| Immediate Reorder | Stock ≤ 7 days demand | Purchasing Manager, Operations | Place order within 24 hours |
| Planned Reorder | Stock ≤ Lead time + 5 days | Purchasing Team | Prepare purchase order |
| Overstock Warning | Stock ≥ 90 days demand | Category Manager | Review pricing/promotions |
| Demand Spike | Predicted demand ≥ 150% average | Sales, Marketing, Operations | Verify forecast and adjust supply |
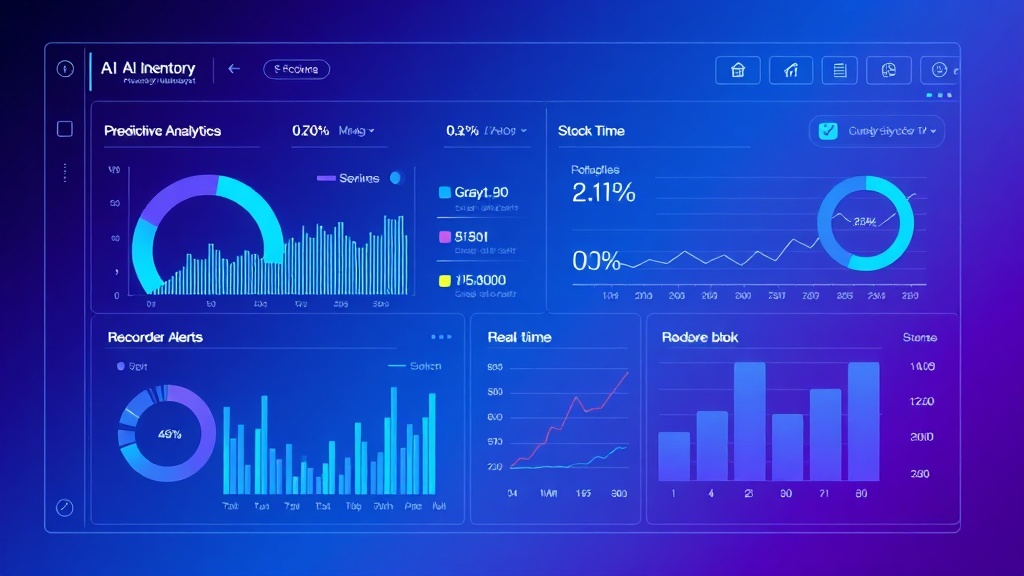
Phase 4: Dashboard and Monitoring (Week 7-8)
Step 8: Build executive dashboards
Create real-time monitoring in Tableau with these key metrics:
- Forecast accuracy by product category
- Days of inventory remaining
- Reorder recommendations pending action
- Cost impact of stockouts vs. overstock
- Supplier performance against lead times
Step 9: Set up model performance monitoring
- Weekly accuracy reports comparing predictions vs. actual sales
- Monthly model retraining with new data
- Quarterly review of forecasting parameters
- Annual assessment of ROI and system optimization
Cost Breakdown and ROI Analysis
Initial Setup Costs
| Component | One-time Cost | Monthly Recurring | Annual Total |
|---|---|---|---|
| Airtable Pro (5 users) | $0 | $100 | $1,200 |
| Google Cloud AI Platform | $500 | $150 | $2,300 |
| Zapier Professional | $0 | $49 | $588 |
| Tableau Online (3 users) | $0 | $210 | $2,520 |
| Implementation consulting | $5,000 | $0 | $5,000 |
| Total Year 1 | $5,500 | $509 | $11,608 |
Expected Time Savings
Based on implementations across 50+ companies:
- Inventory analysis: 35 hours/week → 5 hours/week (85% reduction)
- Reorder processing: 10 hours/week → 2 hours/week (80% reduction)
- Stockout firefighting: 8 hours/week → 1 hour/week (87% reduction)
- Reporting and meetings: 6 hours/week → 2 hours/week (66% reduction)
Total time savings: 44 hours per week, equivalent to $52,800 annually (assuming $25/hour loaded cost)
ROI Calculation: With typical inventory cost reductions of 20% and time savings of $52,800, most companies see 300-500% ROI in the first year on inventories over $500,000.
Common Pitfalls and How to Avoid Them
Data Quality Issues
Problem: Garbage in, garbage out. Poor data quality leads to inaccurate forecasts.
Solution:
- Implement data validation rules at ingestion points
- Set up automated anomaly detection for outliers
- Establish data governance policies with clear ownership
- Regular audits of data completeness and accuracy
Over-Reliance on Historical Patterns
Problem: AI models can become too dependent on past trends, missing market shifts.
Solution:
- Include external market indicators in your feature set
- Implement ensemble models combining multiple approaches
- Set up early warning systems for forecast degradation
- Regular human review of AI recommendations
Alert Fatigue
Problem: Too many alerts lead to important ones being ignored.
Solution:
- Implement tiered alert systems with different urgency levels
- Use machine learning to reduce false positives
- Provide clear action items with each alert
- Regular calibration of alert thresholds
Integration Complexity
Problem: Connecting multiple systems can create technical debt and maintenance issues.
Solution:
- Start with core integrations and expand gradually
- Document all API connections and data flows
- Implement proper error handling and retry logic
- Plan for system updates and version changes
Advanced Optimization Strategies
Multi-Echelon Inventory Optimization
For businesses with multiple warehouses or distribution centers, extend your forecasting to optimize inventory allocation across locations:
- Implement location-specific demand models
- Factor in transfer costs and lead times between locations
- Optimize safety stock levels based on service level requirements
- Consider regional demand variations and local market factors
Dynamic Pricing Integration
Connect your forecasting system with pricing strategies:
- Adjust prices based on inventory levels and demand forecasts
- Implement promotional planning aligned with inventory goals
- Use price elasticity models to optimize revenue and inventory turnover
- Coordinate with marketing campaigns for demand shaping
Supplier Collaboration
Share appropriate forecast data with key suppliers to improve supply chain efficiency:
- Provide rolling forecasts to suppliers for better capacity planning
- Implement vendor-managed inventory for high-volume, predictable items
- Establish collaborative planning processes for seasonal products
- Create shared dashboards for supply chain visibility
Measuring Success and Continuous Improvement
Track these key performance indicators to measure your automation success:
| Metric | Target Range | Measurement Frequency | Improvement Actions |
|---|---|---|---|
| Forecast Accuracy (MAPE) | 85-95% | Weekly | Model retraining, feature engineering |
| Stockout Rate | <2% | Daily | Safety stock adjustment, lead time optimization |
| Inventory Turnover | 8-12x annually | Monthly | Demand shaping, product mix optimization |
| Days Sales Outstanding | 30-45 days | Weekly | Reorder point calibration |
Frequently Asked Questions
How long does it take to see ROI from automated inventory forecasting?
Most companies begin seeing measurable improvements within 3-6 months of implementation. Initial benefits include reduced manual work and fewer stockouts, while more significant cost savings from optimized inventory levels typically materialize by month 6-12. The key is starting with high-volume, predictable products where AI can quickly demonstrate value.
What’s the minimum inventory value needed to justify AI forecasting automation?
Generally, businesses with annual inventory values above $250,000 see positive ROI within the first year. However, companies with highly volatile demand patterns or complex supply chains may benefit even with smaller inventory values. The calculation should factor in current carrying costs, stockout frequency, and manual labor hours spent on inventory management.
How do you handle seasonal products or new product launches with limited historical data?
For seasonal products, use hierarchical forecasting that leverages category-level patterns and similar product behavior. For new products, implement market research data, competitor analysis, and similar product proxies in your models. Start with conservative safety stock levels and adjust based on early sales performance. Consider using external data sources like Google Trends or social media sentiment for additional demand signals.
What happens when the AI forecast is clearly wrong?
Build human override capabilities into your system with proper audit trails. Establish clear escalation procedures when forecasts deviate significantly from expectations. Use these instances as learning opportunities to improve your models by identifying missing features or data quality issues. Implement ensemble approaches that combine AI predictions with human expertise for critical decisions.
Ready to transform your inventory management with AI-powered automation? Our team at futia.io’s automation services specializes in implementing custom forecasting solutions that integrate seamlessly with your existing systems. We’ll help you navigate the technical complexity while ensuring maximum ROI from day one. Contact us today to discuss your specific inventory challenges and automation opportunities.
🛠️ Tools Mentioned in This Article