How to Automate Financial Reporting with AI: Complete Guide to Data-Driven Dashboards
Financial reporting consumes an average of 40-60 hours per month for mid-sized companies, with finance teams spending 70% of their time on data collection and only 30% on analysis. This manual process creates bottlenecks, increases error rates, and delays critical business decisions. Modern AI-powered automation can reduce this workload by 85% while improving accuracy and providing real-time insights.
The traditional financial reporting workflow involves extracting data from multiple sources—ERP systems, CRM platforms, payment processors, and spreadsheets—then manually consolidating, cleaning, and formatting this information into executive-ready reports. This process is not only time-consuming but prone to human error, with studies showing that 88% of spreadsheets contain at least one error.
The Problem: Manual Financial Reporting Bottlenecks
Finance teams face several critical challenges in traditional reporting workflows:
- Data Fragmentation: Financial data lives across 5-15 different systems on average
- Version Control Issues: Multiple team members working on different versions of reports
- Delayed Insights: Reports are often 2-3 weeks behind real-time data
- Resource Allocation: Senior analysts spending time on data entry instead of strategic analysis
- Compliance Risks: Manual processes increase audit trail complexity
Companies using automated financial reporting see 45% faster month-end close processes and 60% reduction in reporting errors. The ROI typically pays for itself within 6-8 months through time savings and improved decision-making speed.
Essential Tools for AI-Powered Financial Reporting Automation
Building an effective automated financial reporting system requires a strategic combination of data integration, processing, and visualization tools. Here’s the core technology stack:
Data Integration and ETL Tools
- Zapier or Microsoft Power Automate: For connecting cloud-based applications ($20-50/month)
- Fivetran or Stitch: For enterprise-grade data pipeline management ($500-2000/month)
- Custom API Integrations: For specialized systems requiring direct connections
Data Processing and AI Analytics
- Python with Pandas/NumPy: For advanced data manipulation and calculations
- Google Cloud AI or AWS Machine Learning: For predictive analytics and anomaly detection
- Databricks: For large-scale data processing and machine learning workflows
Database and Storage Solutions
- PostgreSQL or MySQL: For structured financial data storage
- Amazon Redshift or Google BigQuery: For data warehousing and complex queries
- MongoDB: For flexible document-based financial records
Visualization and Dashboard Tools
- Tableau or Power BI: For executive dashboards ($70-150/user/month)
- Looker or Sisense: For embedded analytics solutions
- Airtable: For collaborative financial planning and lightweight reporting
“The key to successful financial reporting automation is starting with clean data architecture. Garbage in, garbage out applies especially to financial data where accuracy is non-negotiable.” – Sarah Chen, CFO at TechScale Inc.
Step-by-Step Implementation Workflow
Phase 1: Data Source Mapping and Integration (Week 1-2)
Step 1: Audit Current Data Sources
Create a comprehensive inventory of all financial data sources:
- ERP systems (SAP, NetSuite, QuickBooks)
- CRM platforms (Salesforce, HubSpot)
- Payment processors (Stripe, PayPal, Square)
- Banking APIs (Plaid, Yodlee)
- Expense management tools (Expensify, Concur)
- Spreadsheet repositories
Step 2: Design Data Integration Architecture
Map data flow from sources to your central warehouse. For most implementations, this involves:
Source Systems → ETL Pipeline → Data Warehouse → Analytics Layer → DashboardStep 3: Configure API Connections
Set up automated data extraction using tools like Zapier for simple connections or Fivetran for enterprise needs. Key configuration parameters include:
- Extraction frequency (real-time, hourly, daily)
- Data transformation rules
- Error handling and retry logic
- Data validation checkpoints
Phase 2: Data Warehouse Setup and Schema Design (Week 2-3)
Step 4: Implement Dimensional Data Model
Design your data warehouse schema using star or snowflake architecture. Essential tables include:
| Table Type | Purpose | Key Fields | Update Frequency |
|---|---|---|---|
| Fact_Transactions | Core financial transactions | amount, date, account_id, category | Real-time |
| Dim_Accounts | Chart of accounts | account_code, name, type, parent_id | Weekly |
| Dim_Time | Date dimensions | date, month, quarter, fiscal_year | Annual |
| Dim_Entities | Business units/subsidiaries | entity_id, name, region, currency | Monthly |
Step 5: Implement Data Quality Checks
Build automated validation rules to ensure data integrity:
- Balance reconciliation between source and warehouse
- Duplicate transaction detection
- Missing data alerts
- Outlier identification using statistical methods
Phase 3: AI-Powered Analytics Implementation (Week 3-4)
Step 6: Deploy Machine Learning Models
Implement AI models for enhanced financial insights:
- Anomaly Detection: Identify unusual transactions or patterns
- Cash Flow Forecasting: Predict future cash positions based on historical data
- Revenue Recognition: Automate complex revenue calculations
- Expense Categorization: Automatically classify expenses using NLP
For anomaly detection, implement isolation forests or LSTM neural networks to identify transactions that deviate from normal patterns. This typically catches 95% of data entry errors and potential fraud attempts.
Step 7: Create Automated Calculations
Build calculation engines for key financial metrics:
# Example Python code for automated KPI calculation
def calculate_financial_metrics(df):
    metrics = {}
    metrics['gross_margin'] = (df['revenue'] - df['cogs']) / df['revenue']
    metrics['current_ratio'] = df['current_assets'] / df['current_liabilities']
    metrics['days_sales_outstanding'] = (df['accounts_receivable'] / df['revenue']) * 365
    return metrics
Phase 4: Dashboard Development and Deployment (Week 4-5)
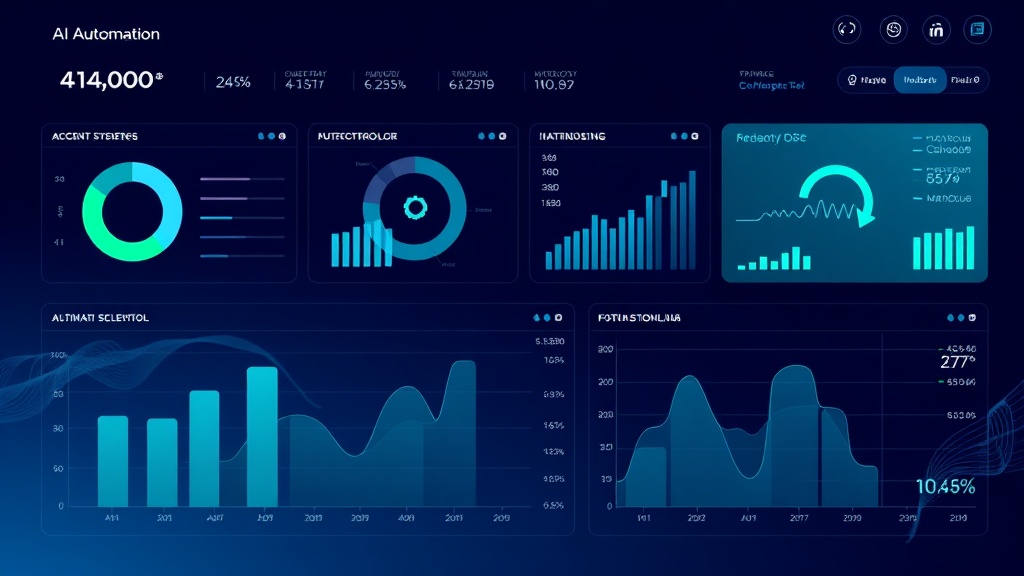
Step 8: Design Executive Dashboard Framework
Create role-based dashboards with appropriate metrics and drill-down capabilities. Use tools like Appsmith for custom dashboard development or Power BI for enterprise solutions.
Essential dashboard components include:
- Executive Summary: High-level KPIs with trend indicators
- P&L Analysis: Interactive profit and loss statements
- Cash Flow Monitoring: Real-time cash position and forecasts
- Budget vs. Actual: Variance analysis with explanatory notes
- Operational Metrics: Department-specific financial performance
Step 9: Implement Alert Systems
Configure automated notifications for critical events:
- Budget variance alerts (>5% deviation)
- Cash flow warnings (projected shortfalls)
- Anomaly detection notifications
- Monthly close completion status
Cost Breakdown and ROI Analysis
The total cost of implementing an automated financial reporting system varies based on company size and complexity:
| Cost Category | Small Business (1-50 employees) | Mid-Market (50-500 employees) | Enterprise (500+ employees) |
|---|---|---|---|
| Software Licenses | $500-1,500/month | $2,000-8,000/month | $10,000-25,000/month |
| Implementation Services | $15,000-40,000 | $50,000-150,000 | $200,000-500,000 |
| Ongoing Maintenance | $200-800/month | $1,000-3,000/month | $5,000-15,000/month |
| Training & Change Management | $5,000-15,000 | $20,000-50,000 | $50,000-100,000 |
Most organizations see positive ROI within 8-12 months through:
- Time Savings: 60-80% reduction in manual reporting tasks
- Error Reduction: 90% fewer data entry mistakes
- Faster Decision Making: Real-time insights vs. week-old reports
- Compliance Efficiency: 50% reduction in audit preparation time
“We reduced our monthly close process from 12 days to 3 days after implementing automated financial reporting. The time savings alone justified the investment, but the improved accuracy and real-time insights transformed how we make business decisions.” – Michael Rodriguez, Finance Director at GrowthCorp
Expected Time Savings and Performance Improvements
Organizations implementing comprehensive financial reporting automation typically achieve:
Immediate Benefits (Month 1-3)
- 40-60% reduction in data collection time
- 25-35% faster report generation
- 90% reduction in manual data entry errors
- Real-time availability of key financial metrics
Medium-term Gains (Month 3-12)
- 70-85% reduction in total reporting workload
- 50% faster month-end close processes
- 3-5 day improvement in financial statement delivery
- 60% increase in time available for financial analysis
Long-term Strategic Value (Year 1+)
- Predictive analytics enabling proactive financial management
- Automated compliance reporting reducing audit costs by 40%
- Self-service analytics empowering departmental budget owners
- Integration capabilities supporting business growth and system changes
Companies using platforms like Amplitude for product analytics often integrate this data into their financial reporting automation to create comprehensive business intelligence dashboards that connect user behavior with revenue metrics.
Common Pitfalls and How to Avoid Them
Data Quality Issues
Problem: Poor data quality leading to inaccurate reports and lost confidence in automated systems.
Solution: Implement comprehensive data validation at every integration point. Create data quality scorecards and establish clear data governance policies. Allocate 30% of project time to data cleansing and validation.
Over-Engineering Initial Implementation
Problem: Attempting to automate every process simultaneously, leading to project delays and budget overruns.
Solution: Start with core P&L reporting and gradually expand. Follow the 80/20 rule—automate the 20% of reports that consume 80% of your time first.
Insufficient Change Management
Problem: User resistance and poor adoption rates due to inadequate training and communication.
Solution: Involve key stakeholders in design decisions. Provide hands-on training and create user champions. Demonstrate quick wins to build confidence in the new system.
Inadequate Testing and Validation
Problem: Automated reports producing incorrect results due to insufficient testing.
Solution: Run parallel systems for 2-3 months during transition. Create comprehensive test cases covering edge scenarios. Implement automated reconciliation between old and new systems.
Neglecting Security and Compliance
Problem: Automated systems creating new security vulnerabilities or compliance gaps.
Solution: Implement role-based access controls from day one. Ensure all data transfers use encryption. Create detailed audit trails for all automated processes. Regular security assessments and compliance reviews.
Advanced Optimization Strategies
Once your basic automation is operational, consider these advanced enhancements:
Intelligent Document Processing
Implement OCR and NLP technologies to automatically process invoices, receipts, and contracts. This can reduce accounts payable processing time by 75% and improve vendor relationship management.
Predictive Financial Modeling
Use machine learning algorithms to create dynamic financial forecasts that automatically adjust based on leading indicators like sales pipeline changes, market conditions, and seasonal patterns.
Automated Variance Analysis
Deploy AI systems that automatically identify and explain budget variances, providing natural language explanations for unusual patterns or deviations from expected performance.
Frequently Asked Questions
How long does it typically take to implement automated financial reporting?
Implementation timeframes vary by complexity, but most organizations can deploy basic automation within 6-12 weeks. Small businesses with simpler requirements often complete implementation in 4-6 weeks, while large enterprises with multiple subsidiaries and complex reporting requirements may need 3-6 months for full deployment.
What’s the minimum data volume needed to justify automation investment?
Automation becomes cost-effective when processing 1,000+ transactions per month or spending more than 20 hours monthly on report preparation. However, companies with high-value transactions or complex compliance requirements often benefit from automation even with lower volumes due to accuracy improvements and audit trail requirements.
Can automated financial reporting handle multi-currency and international operations?
Yes, modern automation platforms excel at multi-currency reporting. They can automatically handle currency conversion, consolidation across entities, and compliance with international accounting standards. Key features include real-time exchange rate updates, translation adjustments, and country-specific reporting formats.
How do you ensure data security in automated financial reporting systems?
Security requires a multi-layered approach including encrypted data transmission, role-based access controls, regular security audits, and compliance with standards like SOX, PCI-DSS, or GDPR. Most enterprise solutions provide built-in security features, but custom implementations require careful security architecture planning.
Ready to transform your financial reporting processes with AI-powered automation? futia.io’s automation services can help you design and implement a custom solution tailored to your organization’s specific needs, ensuring maximum ROI and seamless integration with your existing systems.
🛠️ Tools Mentioned in This Article